


Next: 5 The View Menu
Up: YMLEditor Users Guide
Previous: 3 Project Management
Subsections
4 The Graph Editor
Once you have created a new project or opened an existing one you can start
editing the application and architecture simulation structure using the
graph editor. This section explains the menus and mouse actions used
to operate the graph editor.
4.1 Parts of the Graph Editor
In the picture below, the parts of the graph editor are labeled with numbers.
Each part is referenced by its number and explained below.
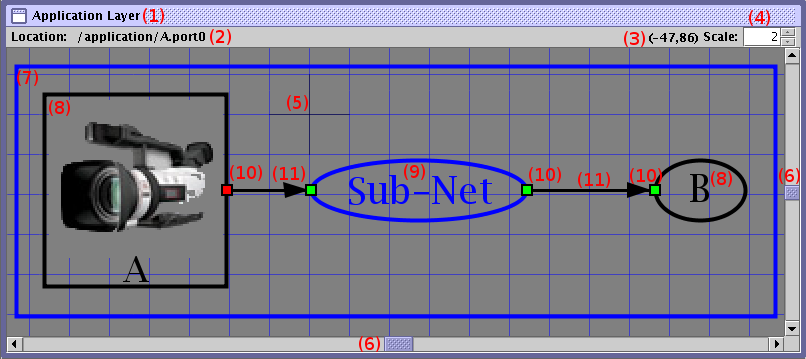
- simulation layer: There is a graph editor for each of the
simulation layers. The name of the simulation layer is displayed here.
- location bar: The location bar indicates where the
displayed network resides in the graph hierarchy. It also displays an
identifier for the currently selected graph object.
- mouse coordinate: The mouse coordinate displays the last
position of the mouse within the graph editor.
- graph scale: The scale dialog indicates the current graph
scale. The graph scale can be changed though this dialog. Clicking
on the arrows will increase or decrease the graph scale. Entering a
numerical value will set the scale.
- graph origin: The cross-hair in the middle of the graph
indicates coordinate (0,0).
- scroll bars: The scroll bars allow you to change the
position of the graph view port.
- parent network: The parent network is represented by
the blue box which encompasses the current graph. When you first
create a new project you will see only a blue box in the center.
This box represents the root network. In the beginning it will
be empty. As nodes are added to the network this box will
automatically change its shape and position so that it always marks
the outer bounds of the network.
- node: Nodes represent simulation components. They can
either be displayed as an ellipse or a rectangle with image. The name
of the port is shown either under the image or in the center of the
ellipse.
- sub-network: Sub-networks are blue instead of black like
nodes. Sub-networks can contain other components inside. Other than
this difference sub-networks can be treated like nodes.
- port: Ports are the communication points of nodes and
networks.
- link: Links symbolize communication channels between
simulation components.
| Note |
|---|
|
With a three button mouse, middle clicking anywhere on the graph
editor will cause it to scale the current graph to fit
and snap the view port to the nearest part of the graph.
|
4.2 Creating Objects
4.2.1 Nodes
Graph nodes are used to represent simulation components. Nodes appear as
black ovals with the node name in the center. If a node is selected it
will appear red instead of black. If a node has an associated image it
will appear rectangular instead of oval and its name will appear under
the image.
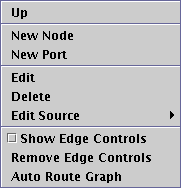
You can create a new node by right clicking anywhere in the graph editor.
This will bring up a popup menu which looks like this:
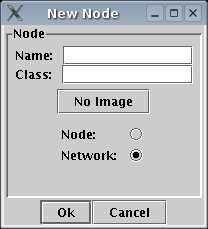
Select the New Node option and the dialog shown below will appear.
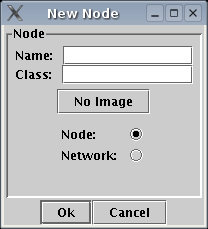
Enter the Name of the new node. Valid names meet the following
conditions:
- A new name cannot be the same as another node or sub-network
name within the current network.
- A new name cannot be empty or only contain white-space
characters. White-space characters are automatically trimmed
from the front and back of all names.
- A new name cannot be this, because this is a
reserved name used in YML to refer to the current network itself.
You may also set the node Class. The Class is used by the
specific simulator to load the simulation component's code at
run-time. If the node Class is not set it is assumed to be the
same as the node Name. If the a corresponding class does not
already exist one will be created. For applications this will be
a C++ class with .h and .cpp files. For architecture and
virtual layer components the class files are .ps and
.pi files.
| Note |
|---|
|
The applications PNRunnerYMLTool
and PearlYMLTool
are responsible for
creating node templates. See the -create-node-template option.
Also notice that in the case of the application layer the
-create-base-classes option is used to maintain application
node base classes which contain each node's ports. Application
nodes which share the same class MUST have the same ports!
|
Finally, you can attach an image to the node by
clicking on the button, which initially says No Image. Select
the Set Image option from the buttons popup menu. This will
open a file dialog from which you can choose an image file. Supported
image formats are GIF, JPEG and PNG.
| Note |
|---|
|
The YMLEditor now encodes image files as text using the base 64 encoding
scheme described in MIME RFC2045
and copies the data directly into the YML image property. This
makes it much easier to keep image files and YML together. You no longer
need to keep a copy of the image in the simulation project.
To extract an image from a YML file you can copy the encoded data to its
own file and decode with a base 64 decoding program such as
uudeview.
|
Click the Ok button to create the new node.
If the node name you have entered is valid a new node will appear in the
graph editor at the position you first right clicked. The bounding
box of the current network may change shape in order to encompass the
new node.
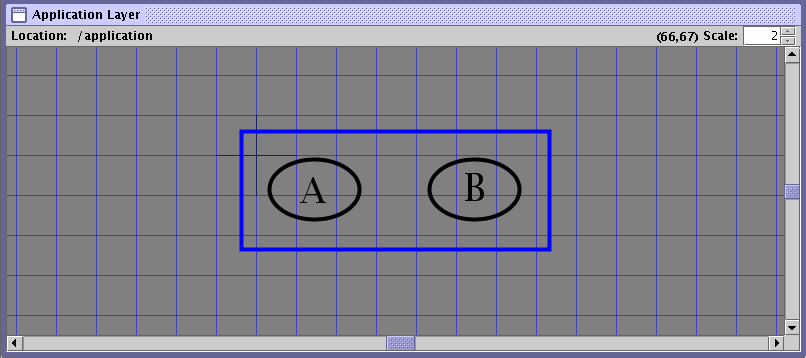
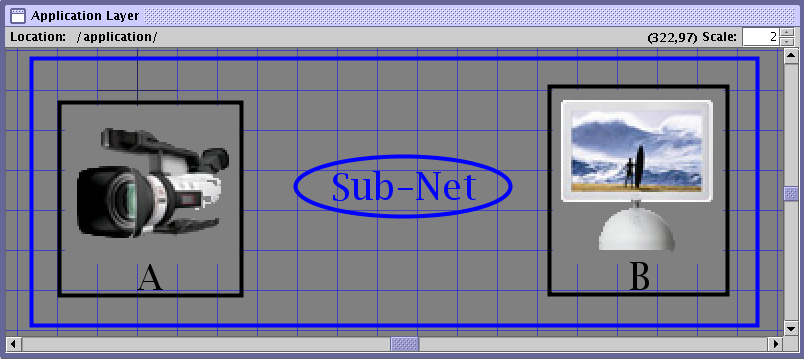
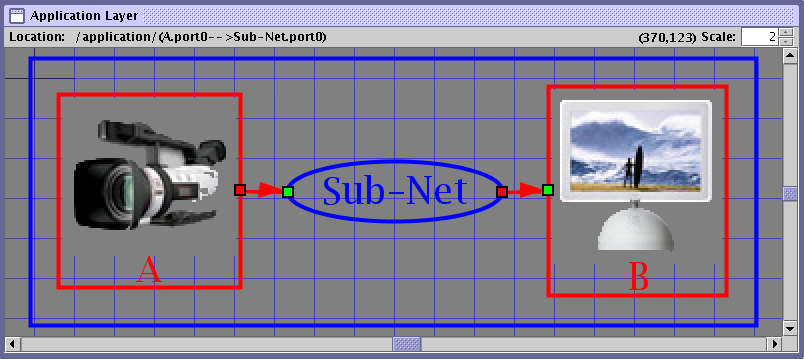
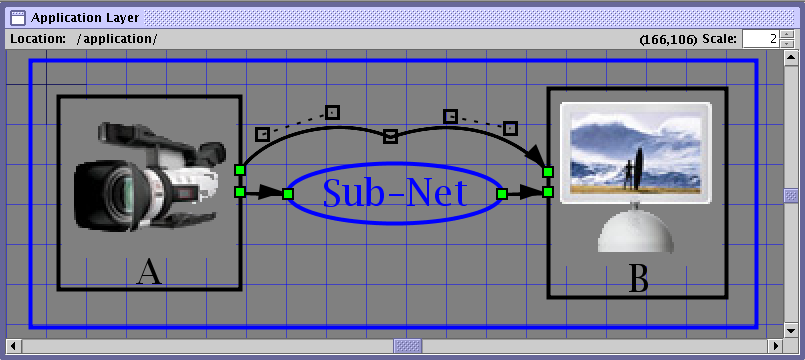
The example below shows the application graph editor with two nodes named
A and B.
4.2.2 Networks
SESAME utilizes hierarchical
component networks. This means that a whole network of components may
be used just like a single component. In fact a subnetwork looks just
like a regular component except that its border is colored blue instead
of black when not selected. You can "zoom in" to a sub-network by double
clicking on it. This will bring up a popup menu giving you the option to
Open Subnetwork. This allows you to move down the network hierarchy.
To move back up right click on the graph editor to bring up the popup menu
and selected the Up option. Selecting the Up option in the
root network has no effect. Each of the graph editors has a location bar
in the top left. This indicates where you are in the graph hierarchy.
The location bar is blank only if no project is loaded. Otherwise it
displays a path to the current network and current selected component if
any.
To create a new network right click on the graph editor to bring up the
popup menu and select New Node. You must select the Network
radio button to create a network instead of a node. New network names must
meet the same requirements as new node names.
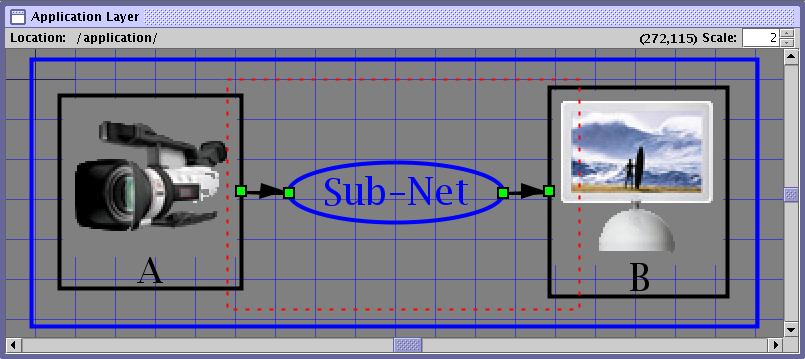
The example below shows two nodes with images and a subnetwork. Notice
the subnetwork is blue. Although the example does not show it,
subnetworks can also have images.
4.2.3 Ports
Nodes and networks can have ports which define their communication points.
Ports appear as small green boxes on the border of a node or network.
They appear red when selected.
To add a new port right click on a node or network
and select New Port from the popup menu. A dialog will appear
like the one below:
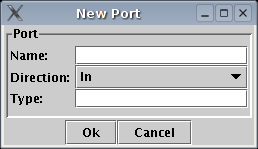
The Name is the port's identifier and must be a unique port name
within its parent component and must not be empty. The Direction can be either In or Out this indicates which
direction data will travel over this port to and from its parent
component. The direction will restrict how you can connect links to
the port. The port's Type indicates what kind of data is
allowed to travel over this port.
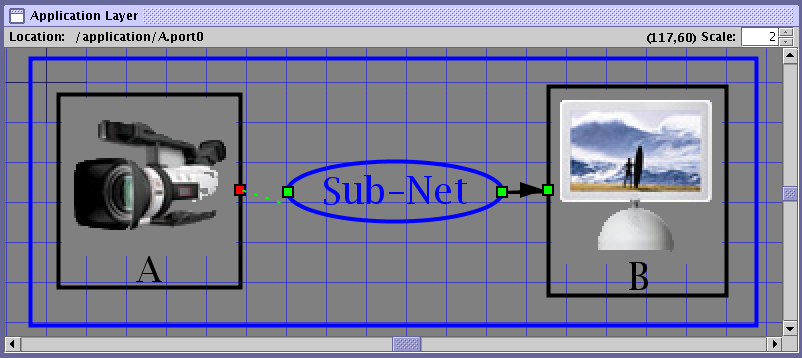
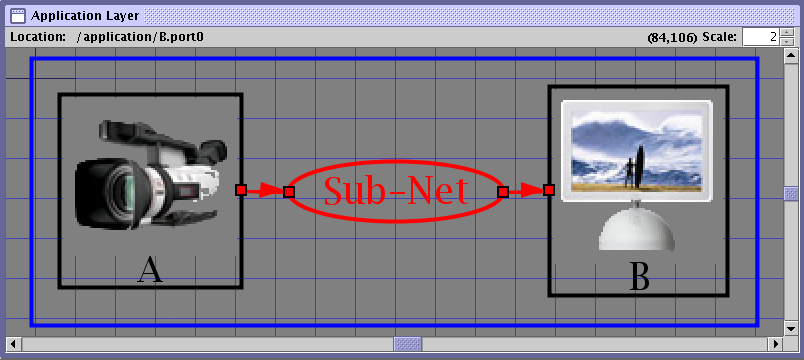
Click the Ok button and if the new port's name is valid a new port
will appear on the selected component. The example below shows some
newly created ports.

In the case of the application editor (i.e. PNRunner) added ports will
be automatically added to the underlying source code via the application
processes' parent class. Note that it is up to the user to ensure that
if two nodes share the same class that they also have the same ports.
Future version of SESAME will alleviate this burden.
When you "zoom in" to a sub-network its ports will appear on the outer
edge of the network. A port may have a different position on the network
when viewed from the inside than it does from the outside of the network.
| Note |
|---|
|
If you created a port and entered a valid port name and the port did not
seem to appear, it may have appeared on top of another port. Try moving
ports around to separate them.
|
4.2.4 Links
Links represent connections between simulation components. Links must be
attached to ports. A link is represented as a black line from one port
to another with an arrow at one end which indicates the direction of the
connection. The port connected to the arrow must be an in port and the
port at the other end must be an out port.
To connect two ports first place the mouse pointer over
one of the ports, then while holding down the shift key and the left mouse
button drag the mouse pointer over to the other port. As you are dragging
a dotted green line will appear which indicates where the link will be made.
The picture below shows a link and a link being created.
4.3 Selecting
Selecting graph objects allows you to perform actions such as move and
delete on a group of graph objects. There are two main selection modes.
Either simple selection using mouse clicks and the control key or by
using the selection box to select groups of objects.
4.3.1 Simple Selection
To select a single object simply
left click on it. This will deselect and previously selected objects.
The newly selected object will turn red indicating that it has be
selected. You can select more than on object by holding down the
control key and left clicking on more objects to add them to the
selection. The control key can also be used to remove object from the
selection. Simply left click on a selected object while holding down
the control key. The picture below shows six out of ten possible
objects selected.
4.3.2 The Selection Box
The selection box can be used to
quickly select several objects at once. To use the selection box
place the mouse outside of the current network. Then hold down the
left mouse button and drag the mouse. A dashed red box will appear.
When you let go of the mouse button all of the object which are
completely enclosed in the selection box will be selected. Any object
not in the selection box will be deselected.
Holding down the control key while dragging the selection box allows
you to add objects to the existing selection. Unlike simple selection
the control key will not remove previously selected object from the
selection.
| Note |
|---|
|
The default action when
you left click and drag within the current network is to move the the
network. Holding down the control key makes the selection box the
default action.
|
The examples below show the selection box and the resulting selection.
4.4 Cut, Copy and Paste Support
As a convenience the YMLEditor
provides Cut, Copy and Paste functions. These options
are available via the graph editor's popup menu. Copy will send
a copy of the currently selected elements to the clipboard. Cut
also copies the current selection to the clipboard, but also removes the
selection from the graph. Paste will insert the contents of the
clipboard into the graph at the position the popup menu was accessed.
Note that you may copy nodes from one graph and paste them into another
and the associated source files will be copied into the directory
associated with the new graph. Pasted graph elements will be renamed
as necessary.
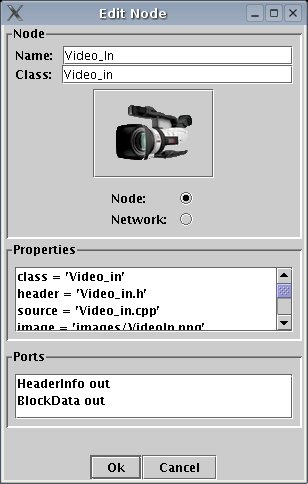
4.5 Editing Objects
Any object in the graph editor can be edited by double clicking on
the object. An appropriate dialog will appear for the selected object.
If you are satisfied with your changes click the Ok button and
the changes will be reflected in the graph. Below is an example of
the Node Editor.
4.6 Properties
Each graph object can have any number of properties. These properties
have different meanings depending on the application looking at the
resulting YML. You will notice the pos property. This is added
by the YMLEditor itself and keeps track of the object's position in
graph layout.
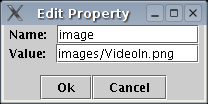
4.6.1 Editing
You can edit an existing property either by double
clicking on the property or right clicking on the property frame and
selecting the Edit Property option from the popup menu. The
Edit Property dialog, shown below, will appear.
4.6.2 Deleting
You can delete an property in one of two ways. Either by selecting the
property and pressing the delete key or by right clicking on the
property and selecting Delete Property from the popup menu.
4.6.3 Creating
To create a new property right click on the property frame and select
New Property from the popup menu. This will open the New
Property dialog. When you are satisfied with the property's name
and value click the Ok button to create the property. The new
property will appear in the list.
4.6.4 Source Code
You can edit the source code for nodes or networks from within the YMLEditor as
long as the source is listed as either a header or source
property. A node's popup-menu will contain an Edit Source sub-menu
if these properties exist. Selecting an item from this menu will open
the source file in the YMLEditor's text edit. nedit by default.
Saving, building, running or closing the project will automatically save any
changes made in the source code editor.
4.7 Deleting
Object can be deleted either by selecting one or more object and pressing
the delete key or by right clicking on an object and selecting the
Delete option from the popup menu. Deleting an object may cause
other object to be deleted if they depend on the deleted object.
Deleting a port will also delete any links attached to it. Deleting
a node will also delete its ports and any links attached to them.
Deleting a network will delete its ports, any links attached to them
and everything inside the network.
4.8 Moving Objects
You can move a single object by placing
the mouse pointer over the object, holding down the left mouse button
and dragging the object to its desired position. To move multiple
object select the desired objects, place the mouse pointer over one of
the select objects, then while holding down the left mouse button drag
to the desired post ion.
| Note |
|---|
|
You may notice that when moving multiple objects, when you first
press the left mouse button your selection seems to disappear and
then reappear when you drag the mouse. This is because the editor is
not yet sure if you are just clicking or dragging. Clicking deselects
all other object and selects the one you clicked on. Dragging moves
the selected group.
|
Object movement is not completely free. The
object follow certain rules described below.
4.8.1 Nodes
Nodes can be move freely, but will also move
the ports and links attached to them. Moving a node can also cause
its parent network to change shape.
4.8.2 Networks
Moving a network will move all the object
inside the network along with it.
4.8.3 Ports
Port movement is restricted to the outer edge
of the port's parent. Moving a port will also move any links attached
to it.
4.8.4 Links
Cannot be move on their own unless they have
control points. Then all the control points will be moved together.
See the the section Routing Links for more information.
4.9 Graph Routing
Graph routing is the process of layout
the position of a graphs components, either manually or with an
automatic router.
4.9.1 Edge Controls
A new link has only two control
points. They are the ports at either end. This only allows for links
as straight lines. To enable routing links around other objects the
path of a link can be described by a series of bezier curves. Bezier
curves have control points which define the path of the curve. In the
YMLEditor these control points are called edge controls. By default
edge controls are invisible. To make them visible you can right click
anywhere on the graph editor to bring up the popup menu and make sure
the Show Edge Controls box is checked. If there are any edge
controls they will appear as two small boxes connected by a dashed
line. Place the mouse pointer over an edge control and drag the mouse
while holding down the left mouse button to move the edge control.
This will allow you to manipulate the bezier curve. The picture below
show an example of a link with edge controls.
4.9.2 Manually Routing Links
You can manually route the
path of a link by adding bezier curves and moving edge controls. To
add a bezier curve to a link double click on the link while holding
down the control key. The first time this is done the link will be
changed from a simple line to a bezier curve. Subsequent additions
will add bezier curve sections. If Show Edge Controls is turned
on two new boxes connected by a dashed line will appear when you add
edge controls. You can remove a section of edge controls by holding
down the shift key and double clicking on one of the edge controls in
a pair.
4.9.3 Auto-Routing
Graph routing by hand can be tedious
especially with large graphs. To auto-route the current graph right
click on the graph editor and select Auto Route Graph from the
popup menu. If the GraphViz
program
dot was found at startup
the graph will be routed. See the section System
Requirements for more about this requirement.
| Note |
|---|
|
If after auto-routing you would like to manually route links, all the
extra edge controls added by the auto-router can become a nuisance.
Right clicking on the graph editor and selecting Remove Edge
Controls from the popup menu will delete all edge controls in the
current graph. This will turn all the edges into straight lines.
|
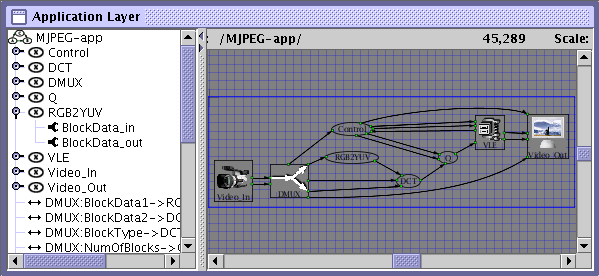
4.10 Graph Tree View
On the left side of each graph
editor is a tree view of the same graph data. This editor may be
closed at program startup and can be opened by holding down the left
mouse button and dragging the panel divider to the right. Many of the
same operations can be performed via the tree views popup menu which
is accessed with a right mouse click. Items in the tree view support
drag and drop copying. To perform this action place the mouse pointer
over an element in the graph tree view, hold down the left mouse button,
drag the item to the desired location and release the mouse. The item
will be copied to the new location in a manner similar to the Cut,
Copy and Paste Support functions described in a previous section.
Next: 5 The View Menu
Up: YMLEditor Users Guide
Previous: 3 Project Management
Joseph Coffland
2006-04-05